


RADAR
A research data analytics platform at Macquarie University, Radar was borne out of the need to have a complete dataset required to submit ERA (Excellence in Research for Australia) reports to the ARC (Australian Research Council).
RADAR aims to facilitate for effective data management and entry, negotiations between researchers and data entry personnel.
Other processes include data quality checks and automated report generation for ARC submission.
The biggest value add of the product is an analytics platform that helps the university identify research areas to focus and invest in for better research outcomes.
Phase 1
Research Outputs
Users can view details of each research paper; allows them to add or edit a claim in percentages to attain grant.
These users then have to negotiate their claims to reach a 100%. In this scenario, shown in the right panel are users Benjamin Jackson and Sally Kensington who had individually claimed a 100%. They would contact each other and either escalate the dispute to the faculty or negotiate amongst themselves to split the claim.

User Problem
Conflicts occured between researchers due to the complex and archaic process of negotiating on coding research papers to attain grants.
Manual coding using excel sheets leads to user frustration and waste of time and money.
Macquarie University was in need of an online platform that would facilitate a complete solution.
Key processes
Wireframing
Design System
User Interface
Material Design
Quasar Framework
Usability Tests
The Solution
Working with the software development team at Constant Consulting as well as the stakeholders at Macquarie University, we delivered a platform that collates all research related data about the outcomes and researchers and provides a negotiation platform on top of it for various stakeholders to manage data and correct them.
The platform connects various data sources in the university and then allows for intelligent “Scenario Testing” on the platform. It also provides a collaborative sandboxed simulation platform where faculties can play with the data and simulate “what-if” scenarios to understand better investment areas for research.
What-if scenario testing
A collaborative sandboxed simulation platform where faculties can play with the data and simulate “what-if” scenarios to understand better investment areas for research.

Achievements
Phase 1
Improved user experience and user interface designs resulted in the gain of trust from users and successful adoption of the platform; conflicts between researchers that emerged from a complex and time-consuming process in negotiations were greatly reduced.
Key contributions and achievements include:
Identify key user problems, needs and job tasks
Fast iterations of sketches as a base to facilitate discussions
Execution and iterations of high-fidelity designs based on stakeholders and users’ feedback
Ran usability tests and collected feedback for improvement in the next iteration
Steering stakeholders and clients to focus on user feedback instead of assumptions as basis to brainstorm solutions to problems.
Streamlined user flow for data submission resulted in reduction of staff count, decreased hours spent on data preparation thus increasing the efficiency of research output reporting by 30%
The platform successfully identified key research areas for focused investment at the university. This initiative led to a 20% improvement in strategic decision-making accuracy
Phase 2
The Portfolios Module
This module helps faculty administrators create portfolios, assign research papers to a portfolio and code the individual portfolio which would then overwrite the individual percentages claims of the research papers.

User Problem
A more complete solution is needed for Radar to meet the needs of all user types. The build of various modules was required to meet those needs, in particular to replacing the manual process of coding in a spreadsheet.
Key processes
Wireframing
Design System
Information Architecture
User Experience and Interface
Material Design
Quasar Framework
Usability Tests
The Solution
We aimed at implementing auto computation and calculation and good user experience to help users work efficiently and concurrently.
The platform facilitates effective data management, data entry, negotiations between researchers and data entry personnel, data quality checks, automated report generation for ARC submission and various workflows pertaining to the organisation processes.

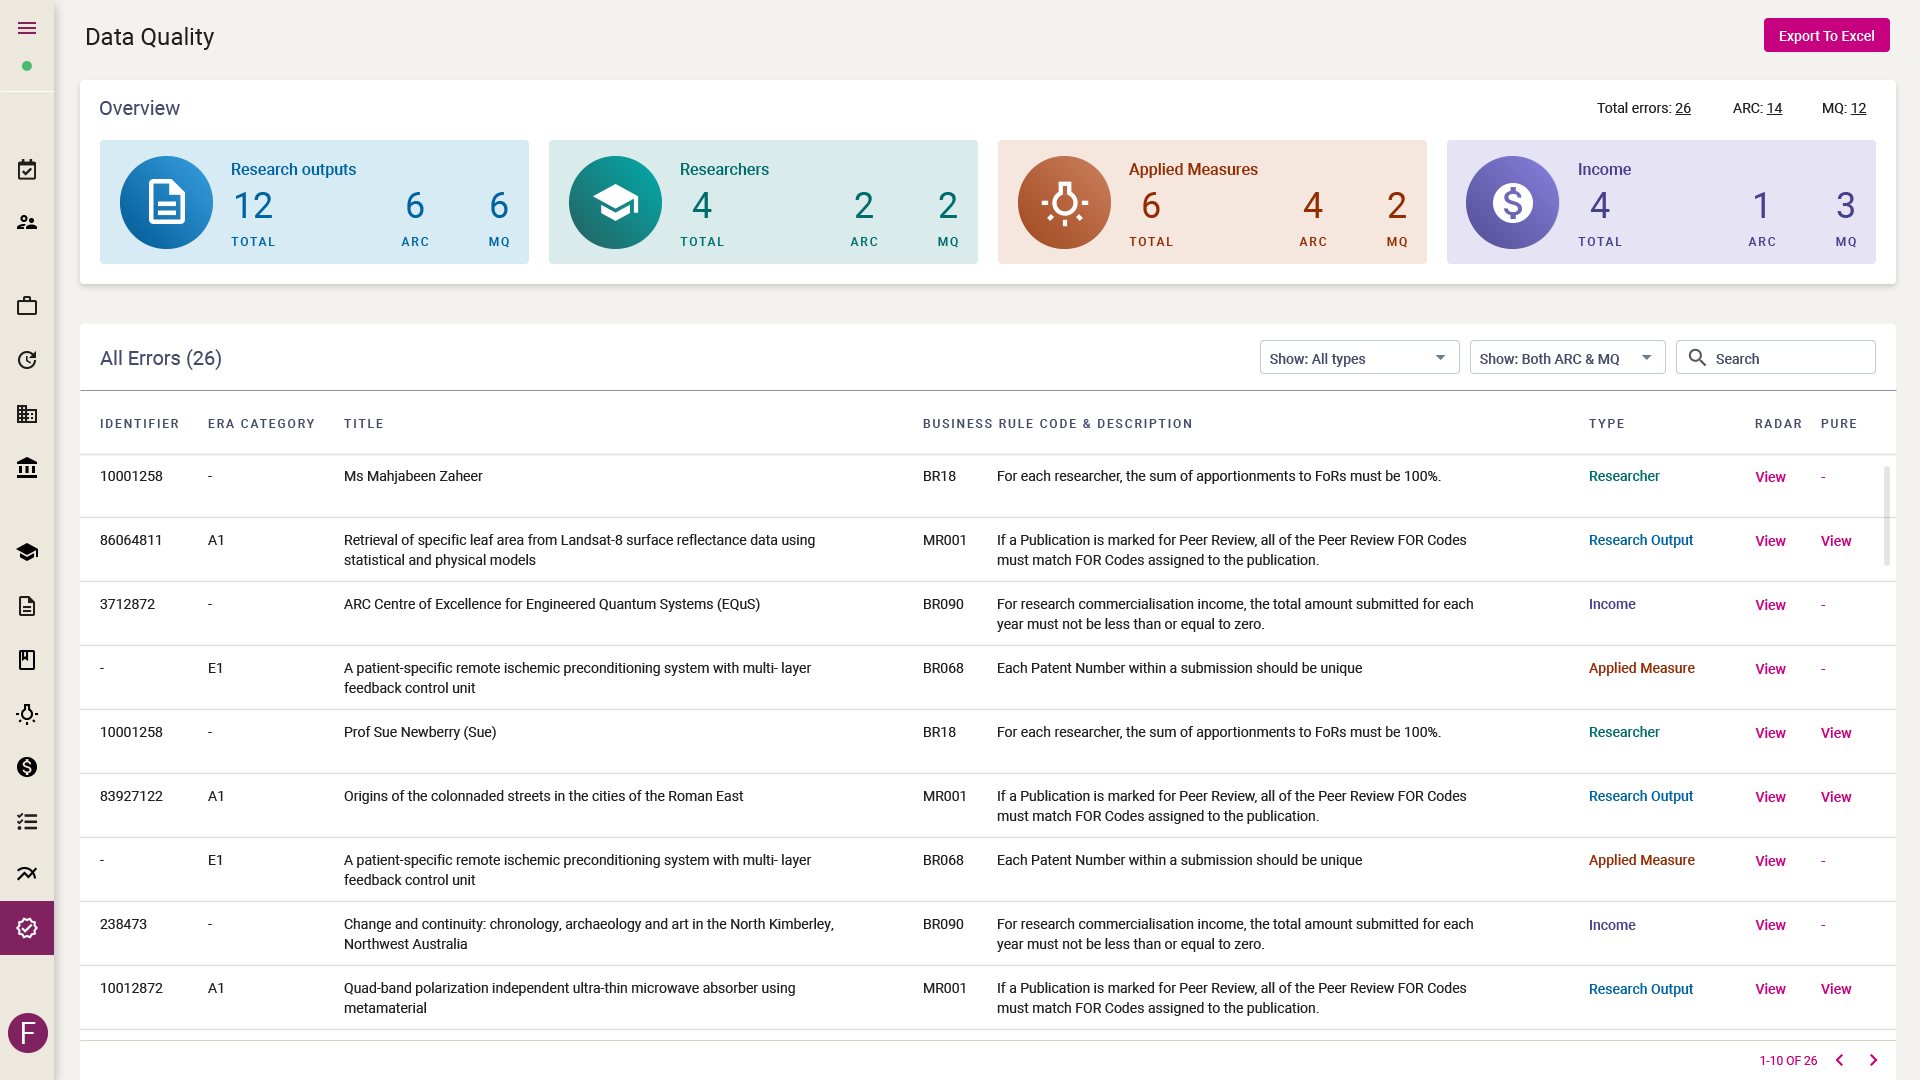
Data Quality
This module assists managers and administrators in managing data quality of all modules.
Achievements
Phase 2
Attained positive client and user feedback of the following modules:
Research Outputs
Researchers
Applied Measures
Income View
Portfolios
Data Quality
The complete solution resulted in the reduction of coding mistakes by users and staff hours. The application enabled strategic value to code for investment areas for research. To-date, the application is known to drive positive culture change amongst Macquarie University staff.
Key contributions include:
Facilitated inception workshops to drive greater collaboration and consensus with the client stakeholders to reveal findings of the business model canvas, user types, user problems / needs, scope, risks, trade-offs and criteria for success.
Assisted in the prioritization of user stories
Defined user journeys
Designed information architecture, wireframes and high-fidelity UI designs.
Presented and explained design rationale.
Facilitated discussion with cross-function team on the iteration of UI designs; ideas and feedback were gathered from all members of the team
Planned user task scenarios and executed usability test sessions with users